Can Quantum Computers Break Bitcoin? What BIP-360 Changes
Not today, but the clock has started. What quantum computers can and can't do to Bitcoin, which coins are exposed, what BIP-360 and BIP-361 propose, and what to do with your addresses.
What Are Tokenized Stocks? What You Actually Own When You Buy Apple on a Blockchain
Tokenized stocks track real shares on a blockchain, but the token is rarely the share. How the four structures differ on dividends, voting, bankruptcy, and redemption, and who can buy them in 2026.
Why Stablecoins Are Becoming the Internet's Payment Rails
Stablecoins settle in minutes, run around the clock, and cross borders for cents. What payment rails are, why stablecoins qualify, and the honest limits.
Agentic Payments & How AI Agents Actually Pay for Things
Agentic payments let an AI agent buy things without holding your money or seeing your card number. How they work, what agents can buy, and how MoonPay's PayBox does it.
For most of crypto's history, the price of admission was a ritual: write down 12 words, in order, on something that can't catch fire or get wet, and guard them for the rest of your life. Get it right and you're your own bank. Get it wrong o
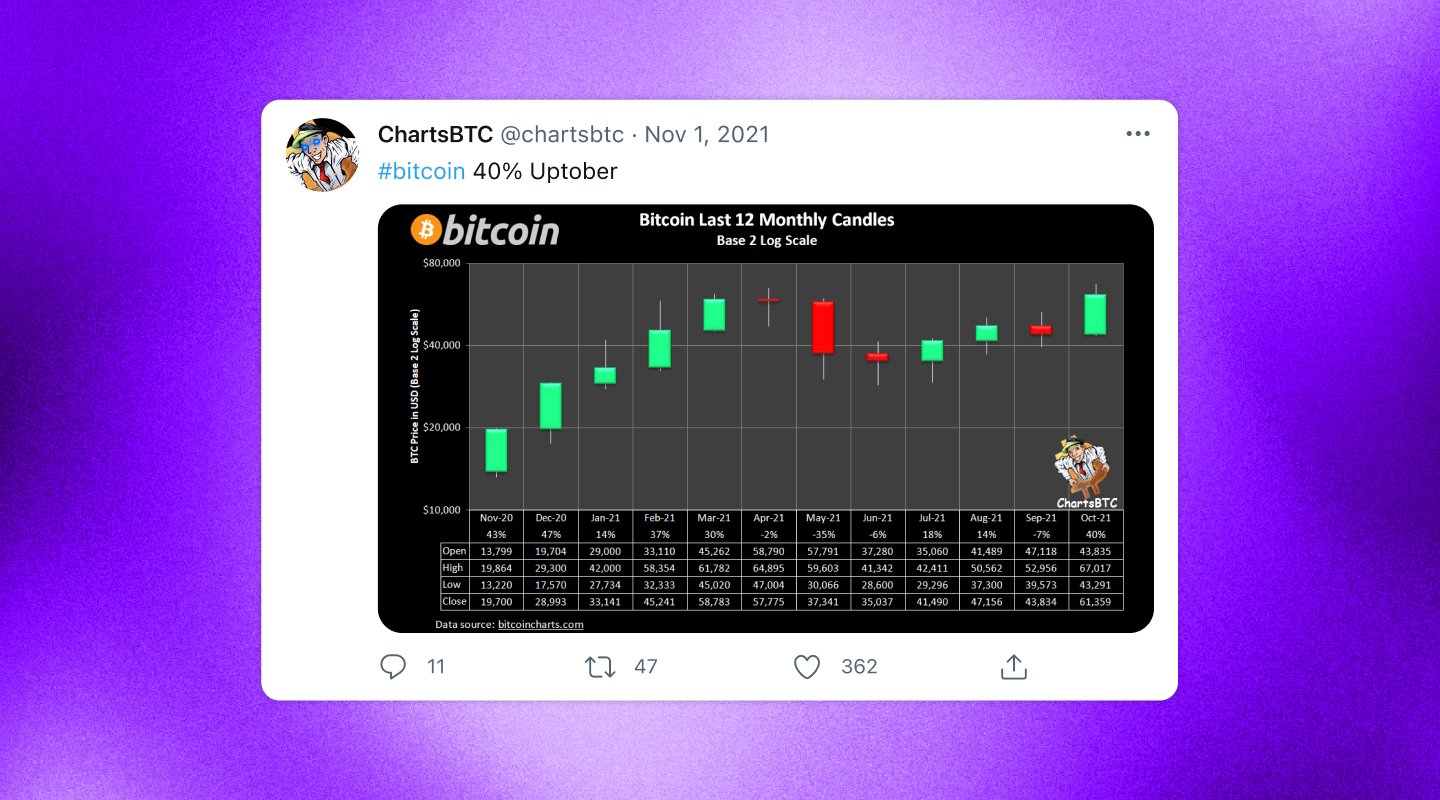
Those who keep a close eye on prices, whether they’re trading or not, relish the opportunity to share screen grabs of price charts to foretell one coin or another’s eventual fate.
To the uninitiated, however, trying to divine something intelligible from these visuals can be as foreign as reading tea leaves. Thankfully, just a little bit of homework can go a long way.
The field of study that examines price trends and patterns is formally known as technical analysis.
“The accuracy of technical analysis comes down to the makeup of the analytical strategy and the ability of the trader to adhere to its core principles,” writes technical analysis blogger Navdeep Singh.
“A technical analysis strategy may work for a certain trader and fail to yield results for another due to differences in application, discipline, etc.”
So it’s all in how you use it. There are countless introductory books and online guides to technical analysis, many of which now contain “cryptocurrency” in the title to attract its newest converts.
For now, we provide a surface overview of three common charts and trendlines to help you make sense of it all.
The candlestick chart
What does an 18th century Japanese rice merchant have to do with crypto? Well, the candlestick chart, a type of chart that’s frequently cited by crypto traders, is purported to have been invented by a man named Munehisa Honma, a rice futures trader and author of the first book on market psychology.
Honma taught that within each bear and bull market are the seeds of its opposite, manifesting the ancient Chinese concept of yin and yang (yin = bear market; yang = bull market). The chart that he invented, somewhat like a bar chart and a line graph combined, elegantly captures these bullish / bearish trends that are used to predict future price movements.
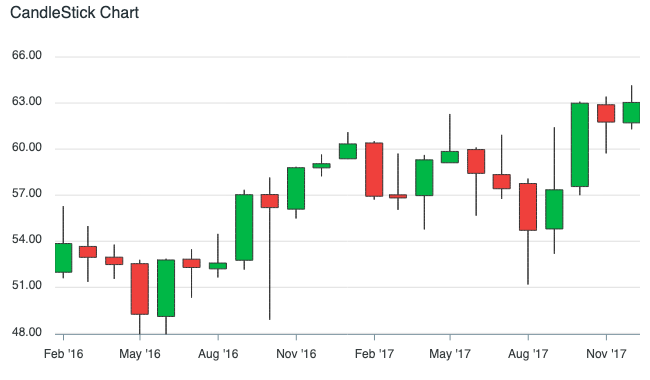
A typical candlestick chart, wicks and all — Image source
There are just five things you need to know to read a candlestick chart:
The “candles” are made up of bodies and wicks.
A body represents the open price and closing price in a candle’s timeframe. For traditional stocks, this is typically one trading day, but for crypto the time frame can be as short as a couple of minutes.
A wick represents the highest price and the lowest price within that same timeframe.
Green candles show prices going up. Red candles show prices going down.
Finally, for a green candle, the open price is at the bottom of the body and the close price is at the top. For red candles it’s the opposite.
And that’s it. Now you have all the knowledge you need to comprehend a candlestick chart and use it as a trading tool.
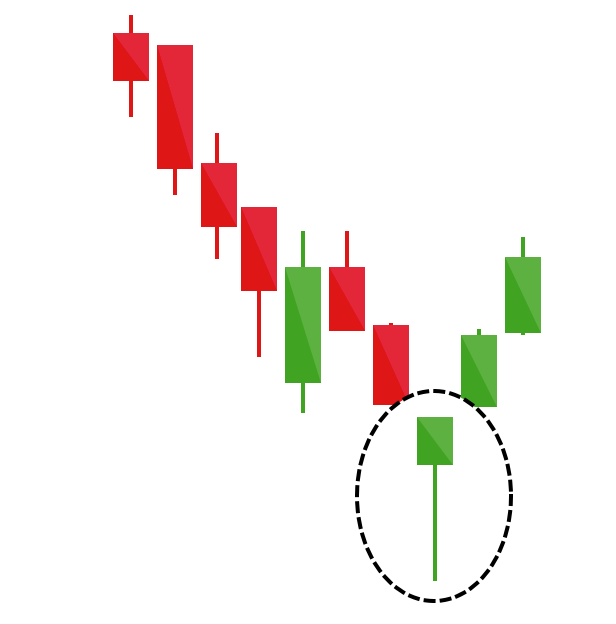
Of course, one can go much deeper and try to learn what to look for. Any given candle or group of candles tells a story. For example, a single candle might be green with a hammer shape (short body with a long wick below). This is a bullish pattern, showing that despite much selling and a low selling price, the price ultimately rose.
The green hammer is a bullish pattern — Image source
Dozens of other patterns, classified by names such the three black crows and evening star, tell other stories, either bullish or bearish.
The next step to mastering candlestick charts: memorize theirpatternsand learn how to spot them.
The triangle pattern
Unfortunately the triangle chart pattern doesn’t have as interesting a backstory as the candlestick chart, but it’s no less popular in the crypto community.
Triangle patterns are very straightforward: they’re simply trendlines that are superimposed over the highs and lows of a price chart. The lines converge to indicate a contraction in the price range (i.e., the gap between the high and low price points gets smaller).
For a triangle pattern to exist, there needs to be at least two highs and at least two lows in the price swings. Obviously the more highs and lows that the trendlines touch, the more reliable the triangle.
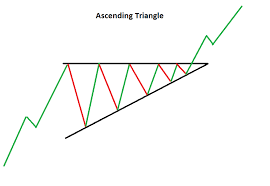
An ascending triangle is when the upper trendline is flat and the bottom trendline ascends upward. What does this indicate? Since the lower line (which touches all the low price points) is in an upward trend, this means buyers are more bullish than the sellers are bearish.
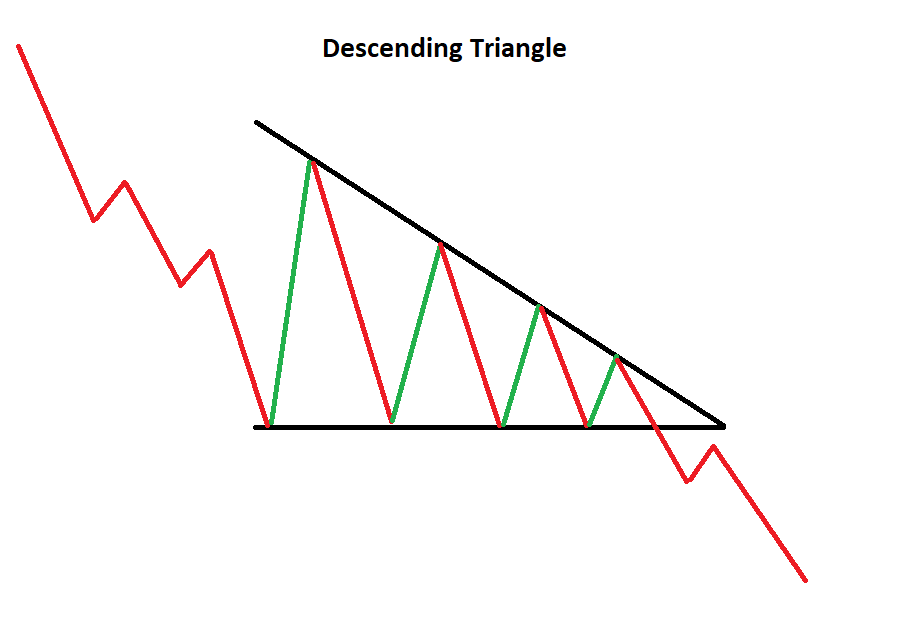
A descending triangle, by contrast, is when the lower trendline is flat and the upper trendline trends downward, indicating the reverse: that sellers are more bearish than the buyers are bullish.
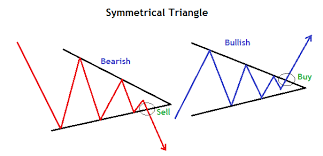
What if neither trendline is flat and both converge towards a central point? This is a symmetrical triangle pattern, which can either be bullish or bearish. If the movement before the triangle’s formation was bullish, then it’s a bullish symmetrical triangle. If the movement was bearish, then it’s a bearish symmetrical triangle.
All four triangle patterns are what technical analysts call “continuation patterns”: patterns that suggest a price trend will continue. Another example of a continuation pattern is a flag.
The next step to mastering triangle patterns is to learn aboutbreakoutsand what they tell you.
The Elliott wave
In the 1930s, American author Ralph Nelson Elliott systematized his long career studying the stock market in a book titled The Wave Principle. In it, he elaborated what has now become known as the Elliott Wave Theory: the idea that apparently random price movements actually follow predictable patterns based on mass psychology, and that these patterns repeat themselves on different scales.
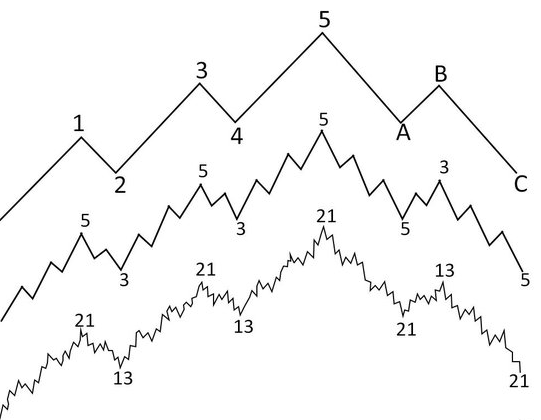
What Elliott found was that the same trends can be identified on the macro and micro levels. A snapshot of a whole year, for example, would look the same as a snapshot of a single day. Price changes are therefore “fractal”, meaning they appear the same at different scales.
Elliott Wave Theory: Looking at the chart pattern since the recent high of 64,870, I can't help but notice that a textbook 5-wave decline may be unfolding. According to EWT, primary trends move in 5 waves and corrections are 3 waves.
The way this looks on a chart is that price waves develop either in a straight line (impulse) or up and down (correction). Prices alternate between the two, with the impulse phase lasting five waves and the correction phase lasting three waves.
Same trends, different scales: a representation of the Elliot Wave Theory — Image source
According to the Credit Suisse report Technical Analysis Explained, “given a series of 5- and 3-wave patterns, the investor should be able to predict the continuation of the next 5-3 pattern until a larger wave pattern is completed.”
In other words, Elliot waves are trends within trends within trends. Bullish and bearish behavior in one time frame ultimately predicts the same behavior in another, from what Elliott called the “Sub-Minuette” to the “Grand Supercycle”. One blogger wrote that it’s a bit like broccoli: as you break it down piece by piece, it’s the same thing, just different scales.
View our Bitcoin Price and Ethereum Price pages for live price and market data for these leading cryptocurrencies.
Start your crypto journey with MoonPay
MoonPay's simple payments solution is the best way to start your crypto journey and grow your portfolio. We accept most major payment methods and over 30 fiat currencies, enabling you to buy and sell crypto your way.
To get started, simply buy Bitcoin or your preferred cryptocurrency via MoonPay using your credit card or any other payment method.