Candlestick charts are one of the fastest ways to understand what crypto price is doing right now, and what it has been doing over the last hour, day, or month. But they are also one of the easiest tools to misuse. A single candle can look “bullish” or “bearish” and still be meaningless if you ignore trend, liquidity, and the timeframe you are looking at.
This guide is built for crypto specifically (24/7 markets, frequent volatility spikes, and the kind of long wicks you rarely see in traditional markets). By the end, you will be able to read crypto candlesticks with a repeatable process, understand what candle wicks mean in trading, and recognize a handful of crypto candlestick patterns without turning chart-reading into pattern memorization.
If you want a broader primer before diving into candlesticks, start with MoonPay’s guide on how to read crypto price charts.
Educational only. This is not financial advice, and candlestick analysis does not guarantee outcomes.
What is a candlestick chart in crypto?
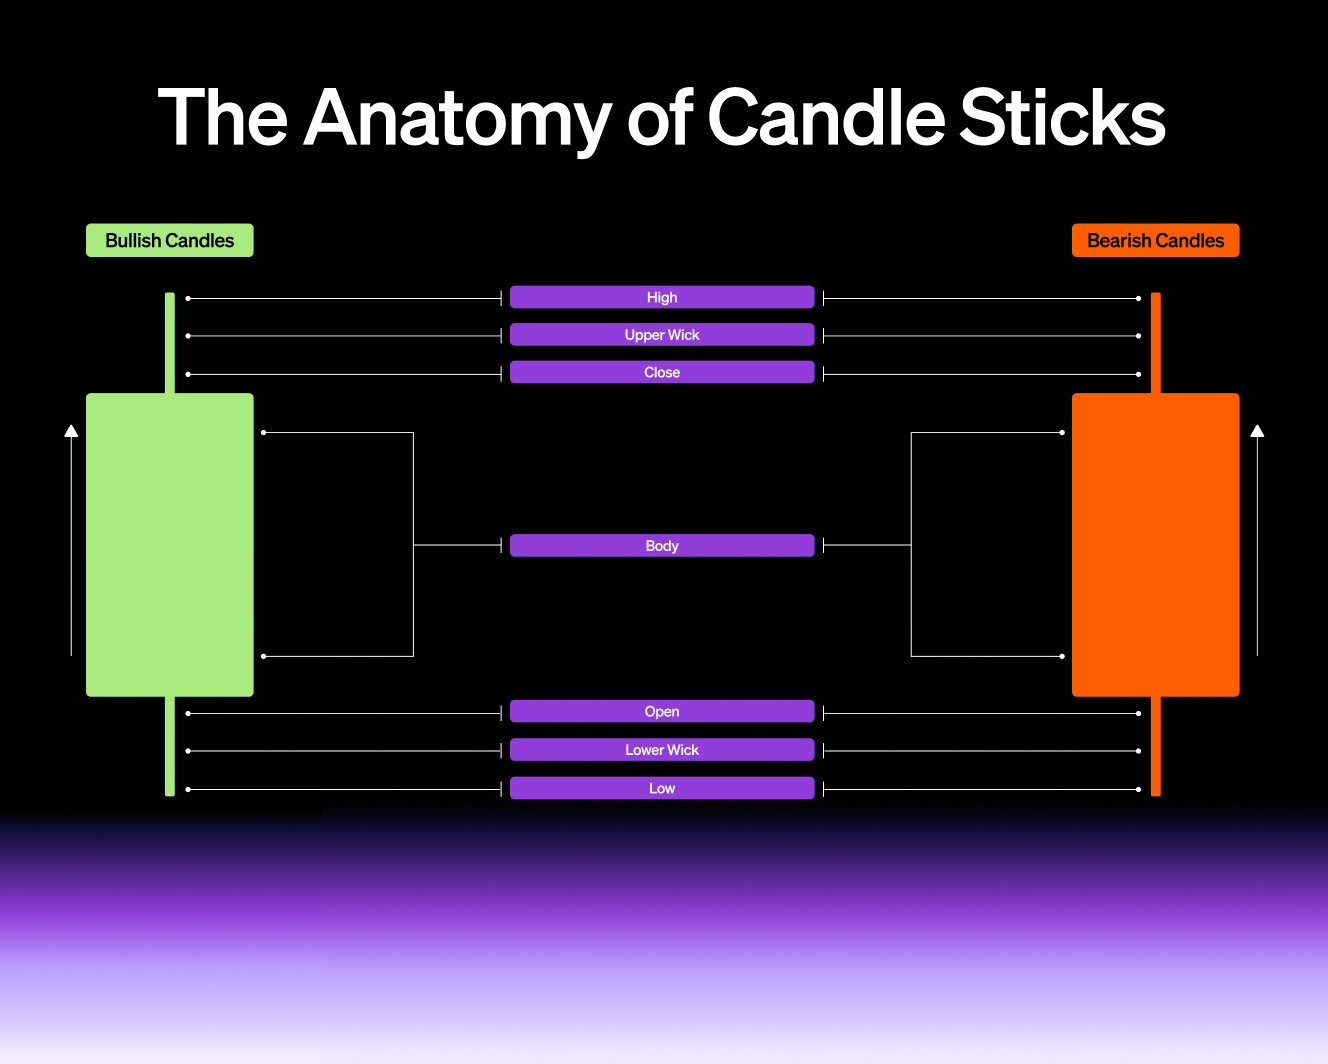
A candlestick chart visualizes price movement over a chosen time interval, like 1 minute, 1 hour, or 1 day. Each candlestick summarizes four key prices for that interval:
- Open: the first traded price in that interval
- High: the highest traded price
- Low: the lowest traded price
- Close: the last traded price
In crypto, there is no “market open” like U.S. stocks, so open and close are defined by the timeframe you choose. A daily (1D) candle “opens” at the start of that day on that chart and “closes” at the end, every day, because crypto trades around the clock.
When people search “how to read crypto charts” or “how to read a cryptocurrency chart,” what they usually want is not just the definition. They want to know what the candle is telling them about behavior. That is where the anatomy matters.
Candlestick anatomy: body, wicks, and color (what it actually tells you)
A candlestick has two main parts:
- The body
- The wicks (also called shadows)
The body (open to close)
The body is the distance between open and close. It is the clearest signal of directional push during that interval.
- If the close is higher than the open, the candle is typically green (a “green candle crypto” search).
- If the close is lower than the open, the candle is typically red (a “red candles crypto” search).
Platforms can swap colors depending on theme settings, but the meaning is always close vs open.
The wicks (high and low)
Wicks show how far price traveled away from the body during the interval. They often represent attempts that failed.
- A long upper wick means price traded higher but was pushed back down before closing.
- A long lower wick means price traded lower but was pushed back up before closing.
If you have ever wondered “what do the candle wicks mean in trading,” the simplest answer is: wicks often represent rejection and volatility inside the interval, not just direction.
Here are quick interpretations that are useful for beginners, especially when learning how to read crypto candles:
- Long body, small wicks: sustained pressure in one direction
- Small body, long wicks: uncertainty and tug-of-war
- Long upper wick: sellers (or profit-taking) pushed price down from highs
- Long lower wick: buyers pushed price up from lows
- Long wicks on both sides: high volatility, often common in crypto
Crypto nuance: wicks can be exaggerated in thinner markets, during sudden news, or in low-liquidity pairs. A dramatic wick can look meaningful while actually being the result of a brief liquidity vacuum.
The most important skill: reading candlesticks in context
Candlesticks are not signals by themselves. They are evidence. Context determines whether that evidence matters.
1) Trend context
A candle that looks bearish inside a strong uptrend can be a pause, not a reversal. A candle that looks bullish inside a downtrend can be a bounce, not a bottom.
If you want a simple framework for trend language, MoonPay’s explainer on bull and bear markets helps anchor what “uptrend” and “downtrend” actually mean in a broader market sense.
2) Location context (levels)
Candles matter more near obvious levels, like a prior swing high, swing low, or a widely watched round number. That is where markets tend to react. The same candle in the middle of nowhere is often just noise.
3) Market regime (trending vs ranging)
In a range, many “reversal” patterns fail because price is already oscillating. In a trend, patterns that confirm continuation can work better. Your job is not to predict. Your job is to identify what kind of environment you are in and read candles accordingly.
4) Crypto-specific context (liquidity and market structure)
Crypto markets run 24/7, and liquidity varies dramatically across tokens and venues. Thin liquidity can create wicks that look like strong rejections when they are simply a temporary imbalance.
Also, price movement alone does not tell you the whole story of “size” or “importance.” If you are building intuition, it helps to understand market capitalization in crypto, because a $0.10 move can mean very different things depending on supply and market cap.
Choosing timeframes: why crypto traders use more than one
Timeframe changes everything. The same pattern can mean opposite things depending on whether it appears on a 5-minute chart or a daily chart.
- Lower timeframes (1m to 15m): more noise, more false signals
- Mid timeframes (1H to 4H): often the best compromise between responsiveness and signal
- Higher timeframes (1D to 1W): fewer signals, but often more meaningful structure
A practical approach if you are learning how to read candlestick charts:
- Start on 1D to understand the bigger picture
- Drop to 4H to see structure and key levels
- Use 1H or 15m only if you need more detail on what is happening “inside” the move
Crypto does not sleep, but your analysis should still start broad. Most beginners do the opposite and get trapped in noisy candles.
High-signal single-candle reads (without the hype)
This section covers a few common “single candle” concepts that show up in searches like “doji candlestick,” “hammer candlestick,” or “how to read candlesticks.” The key is to treat them as clues, not answers.
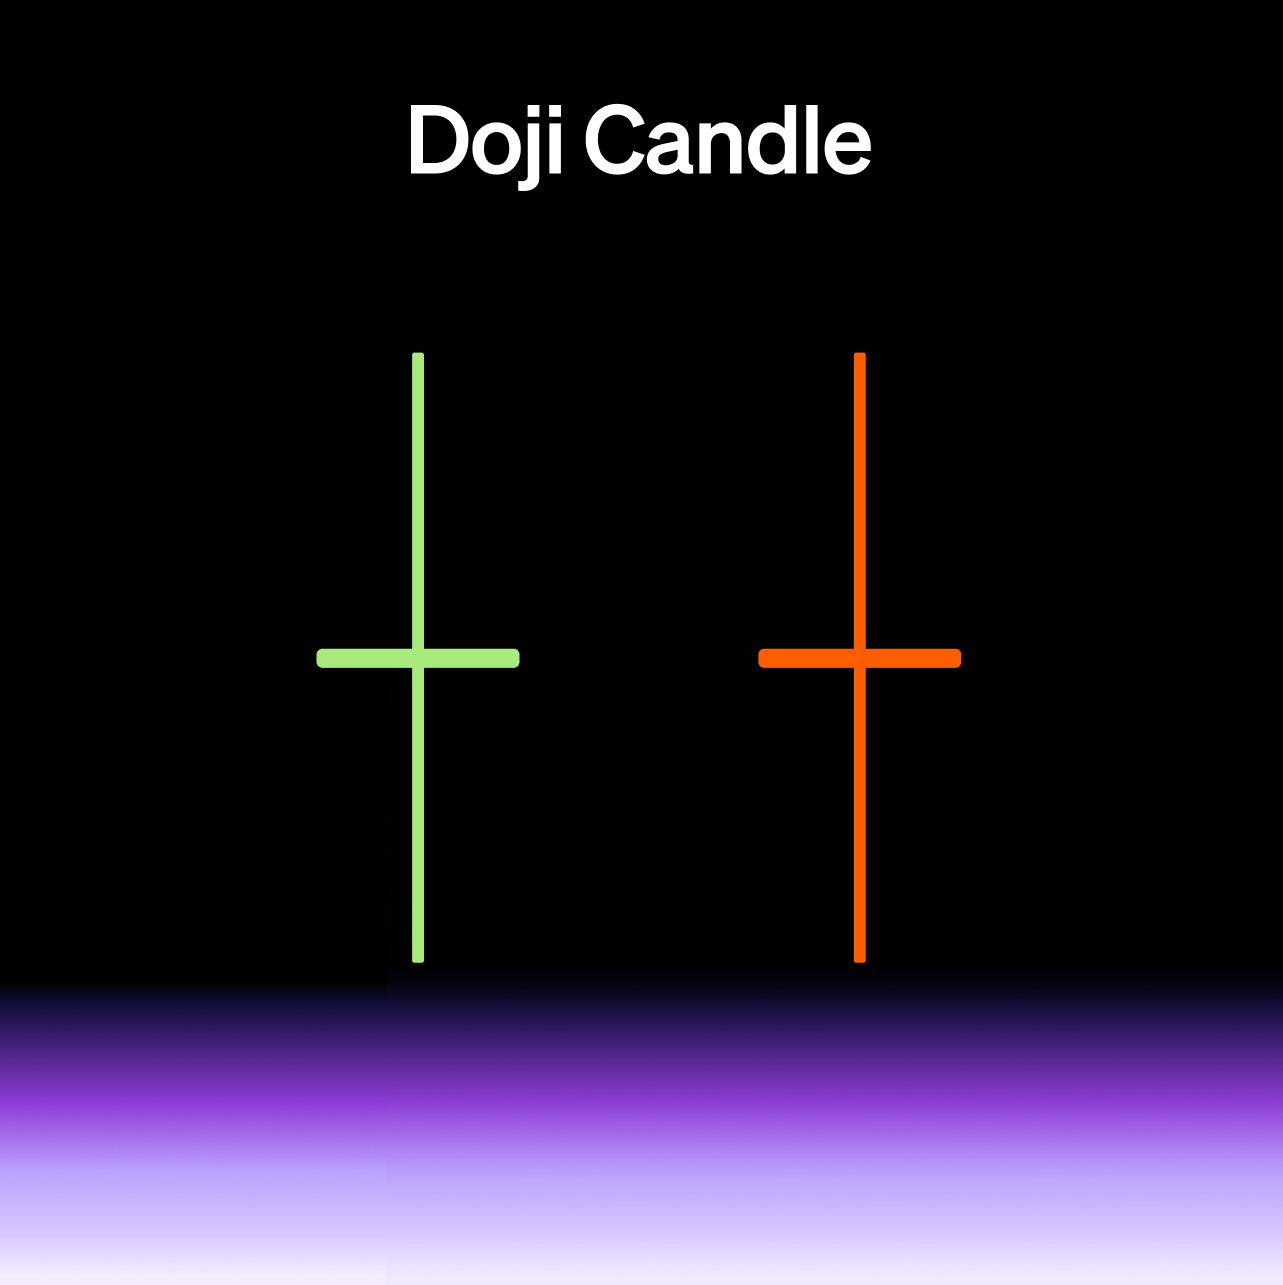
Doji candlestick
A doji has a small body because open and close are near each other. It suggests balance or indecision in that interval.
- Stronger when it appears near a key level after a sustained move
- Weaker when it appears inside a choppy range
Hammer candlestick (long lower wick)
A hammer is often described as a small body with a long lower wick, showing price moved down but recovered.
In crypto, the best way to read a hammer is as “buyers absorbed selling pressure,” but only if the next candle confirms with follow-through. Without confirmation, it may just be volatility.
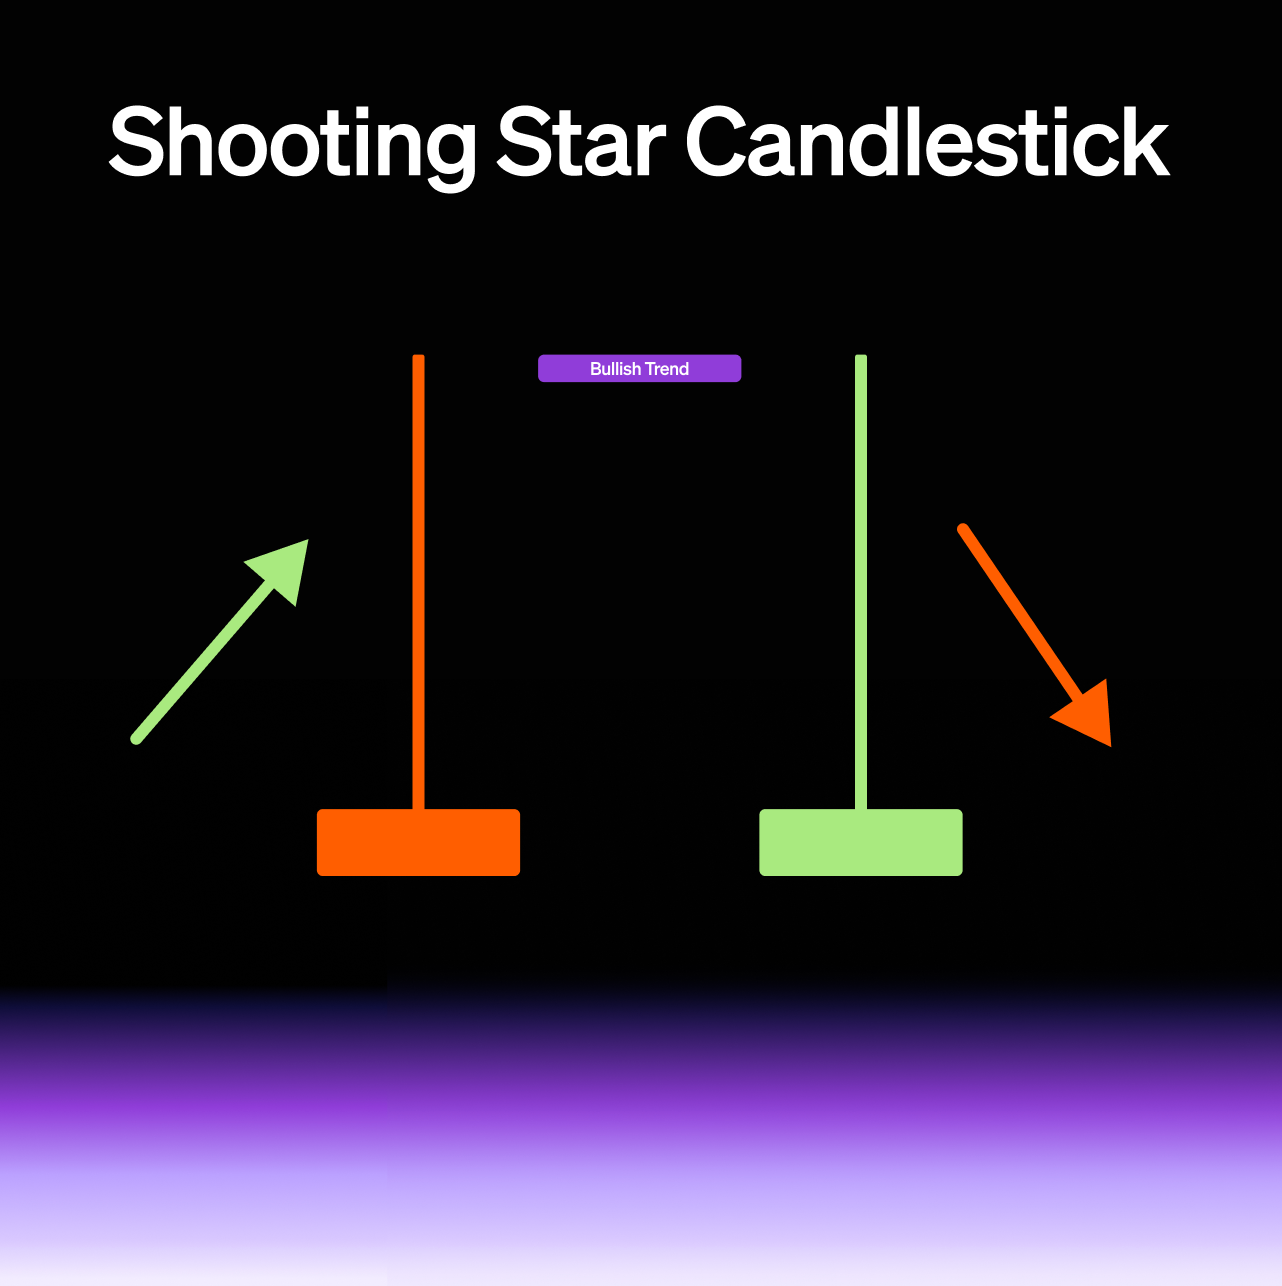
Shooting star (long upper wick)
A shooting star is the mirror: price pushed up, then rejected and fell back before close. Again, confirmation matters.
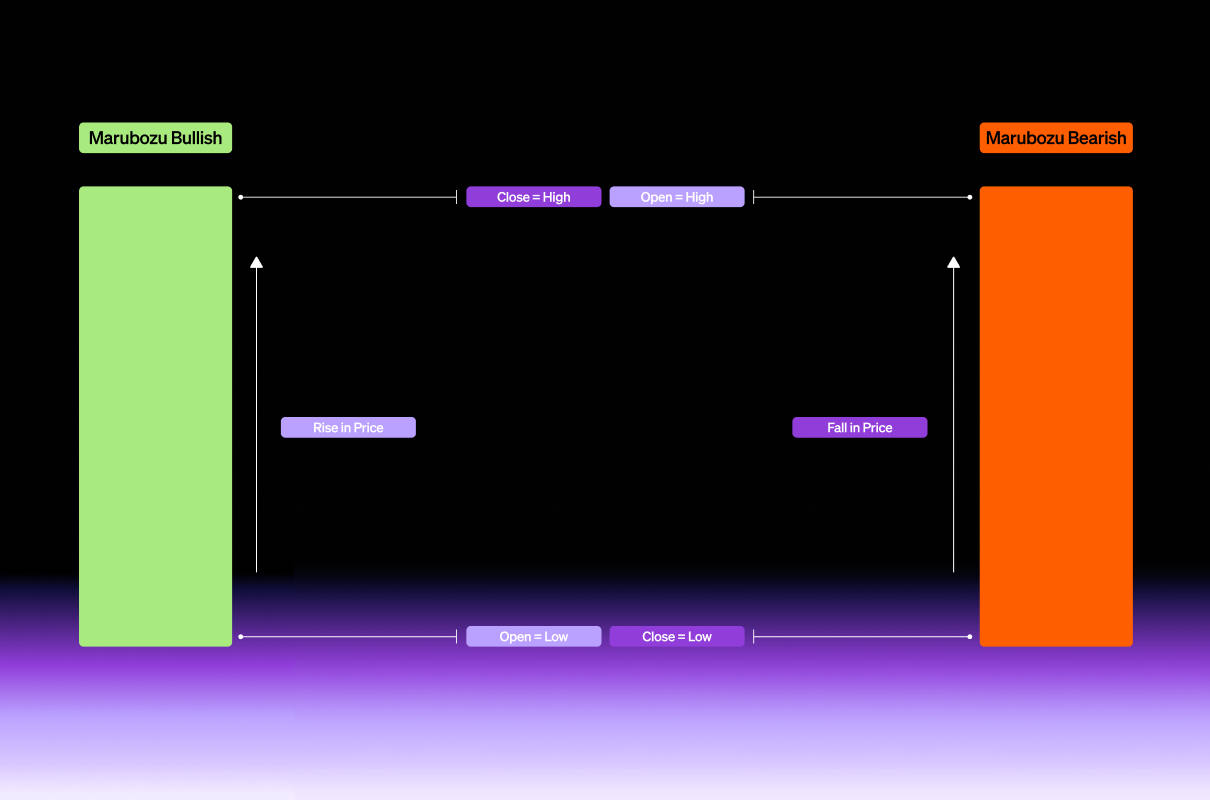
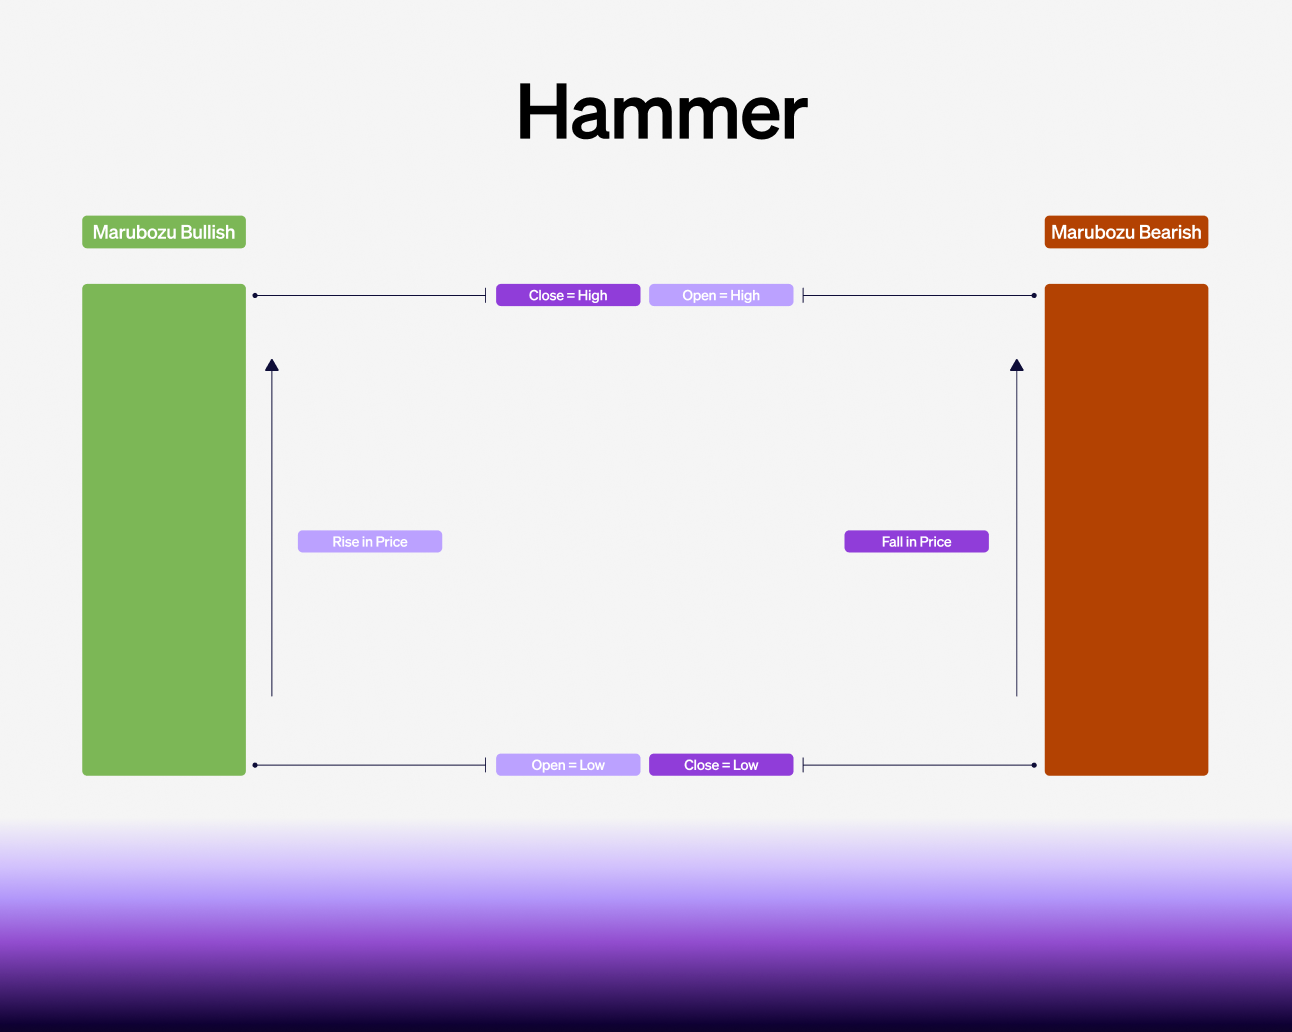
Marubozu (big body, small wicks)
A long body with minimal wicks can signal strong momentum in that interval. In crypto, these candles often appear during impulsive moves, but they can also show up near exhaustion points, especially after a prolonged run.
Confirmation rule of thumb: one candle suggests; the next candle confirms or invalidates.
Crypto candlestick patterns worth knowing (and when they fail)
There are dozens of candlestick patterns. Most people who search “candlestick patterns crypto” or “crypto candlestick patterns” fall into a trap of trying to memorize them all. A better approach is to learn a small set and apply them with context.
Below are a few multi-candle patterns that are common, useful, and easy to interpret.
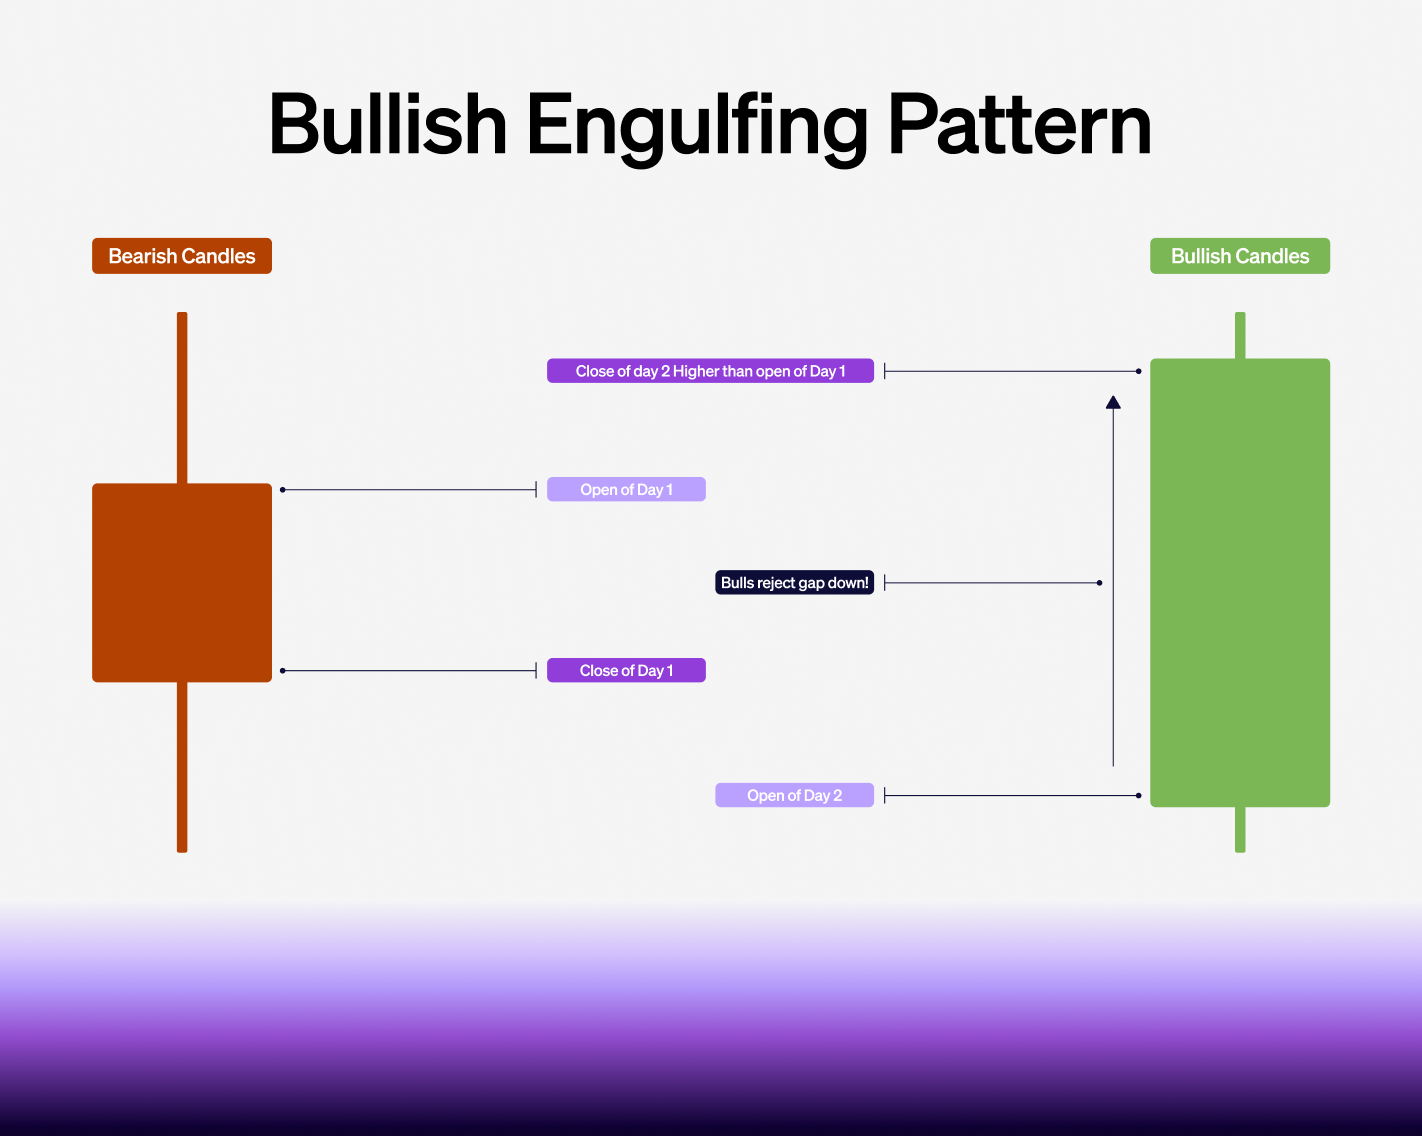
Bullish engulfing candle
A bullish engulfing pattern usually involves a down candle followed by a larger up candle that “engulfs” the prior body. It can suggest momentum shifting from sellers to buyers.
Best conditions:
- After a pullback in an uptrend
- Near a support area or a prior low
Common crypto failure mode:
- Appears during a low-liquidity wick event and is immediately retraced
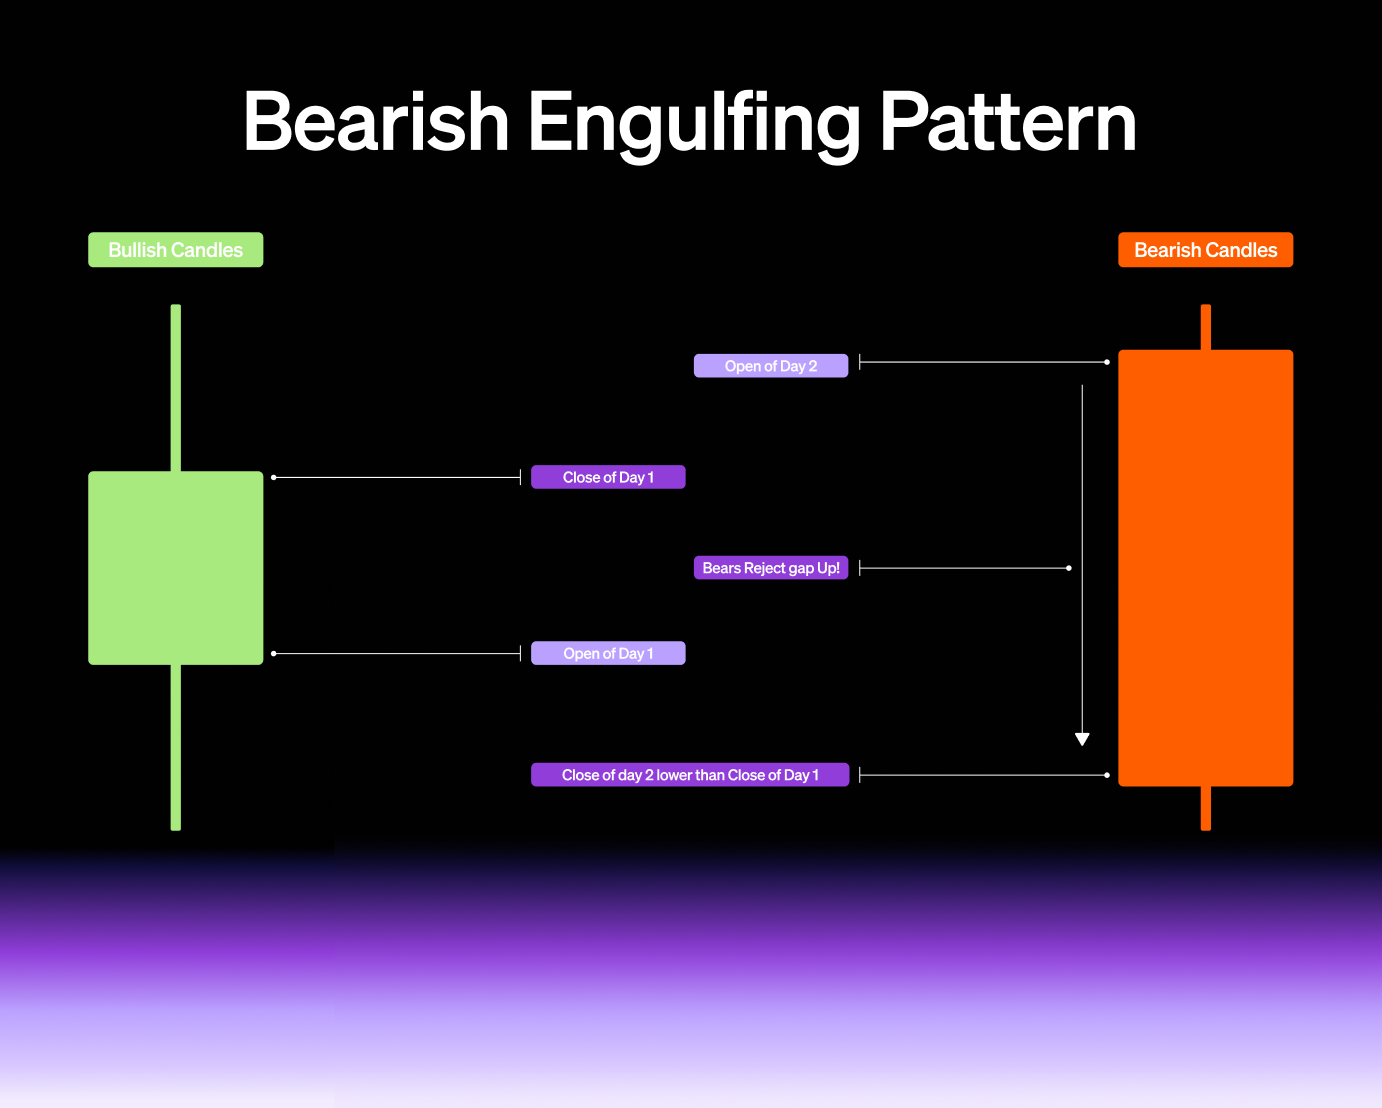
Bearish engulfing candle
The opposite: an up candle followed by a larger down candle that engulfs the prior body.
Best conditions:
- After a push up into resistance
- After extended upside with weakening follow-through
Failure mode:
- Appears mid-range and does not matter because the market is not at a decision point
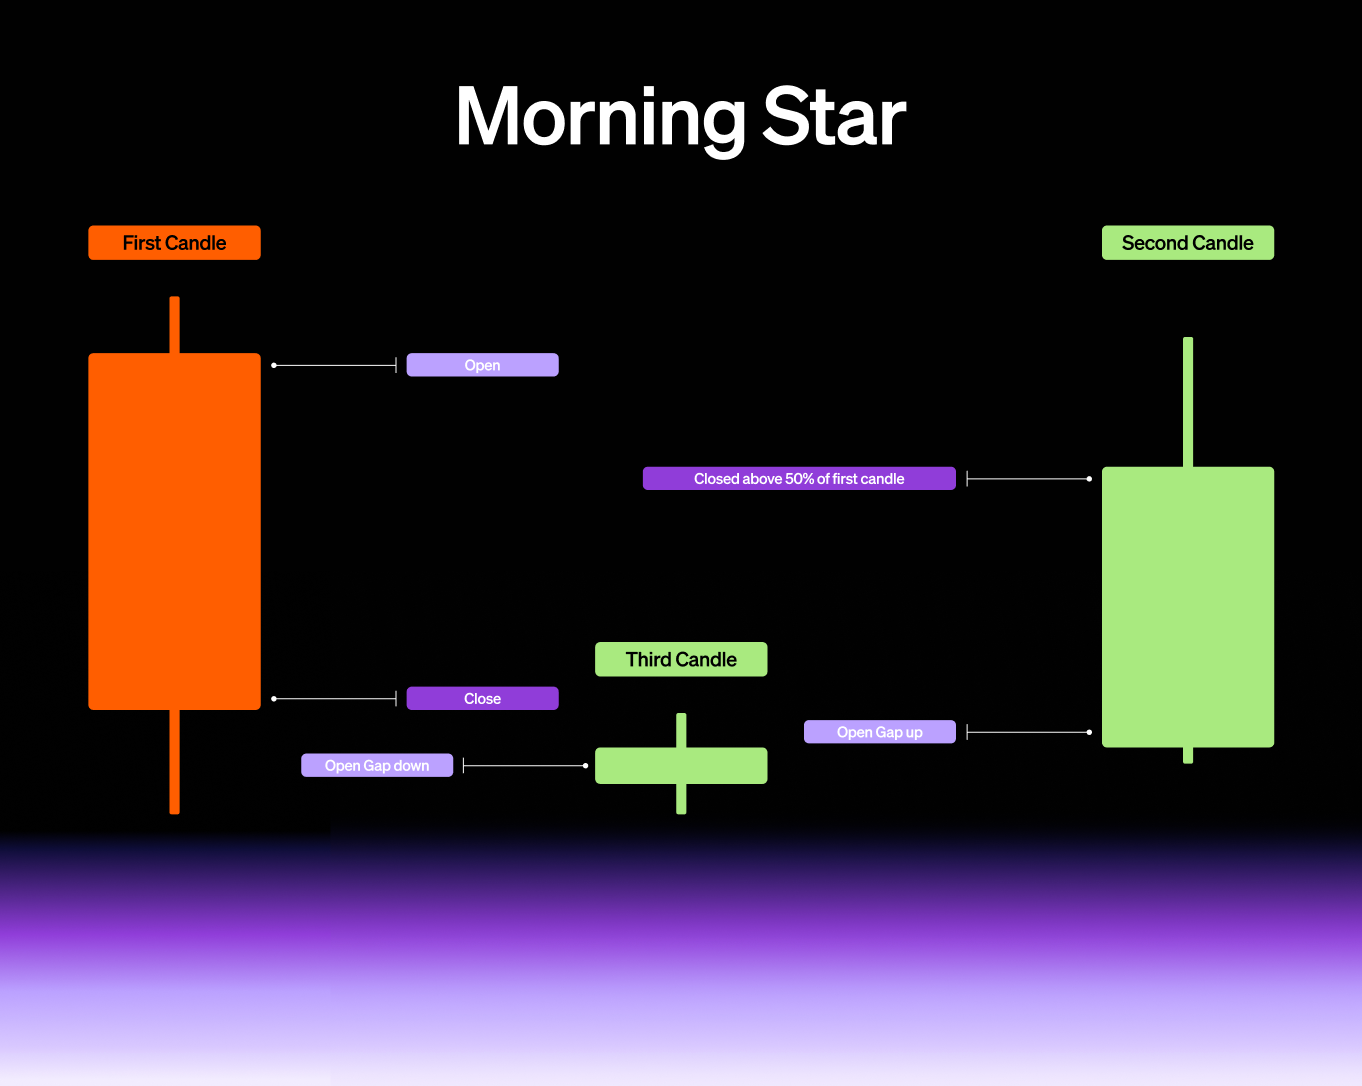
Morning star candlestick
Often described as a three-candle reversal structure: down candle, then a small indecision candle, then an up candle that regains ground.
Best conditions:
- After sustained downside, near a prior support zone
- Stronger if the final candle closes well into the first candle’s body
Failure mode:
- Occurs during a news spike, then fades as liquidity normalizes
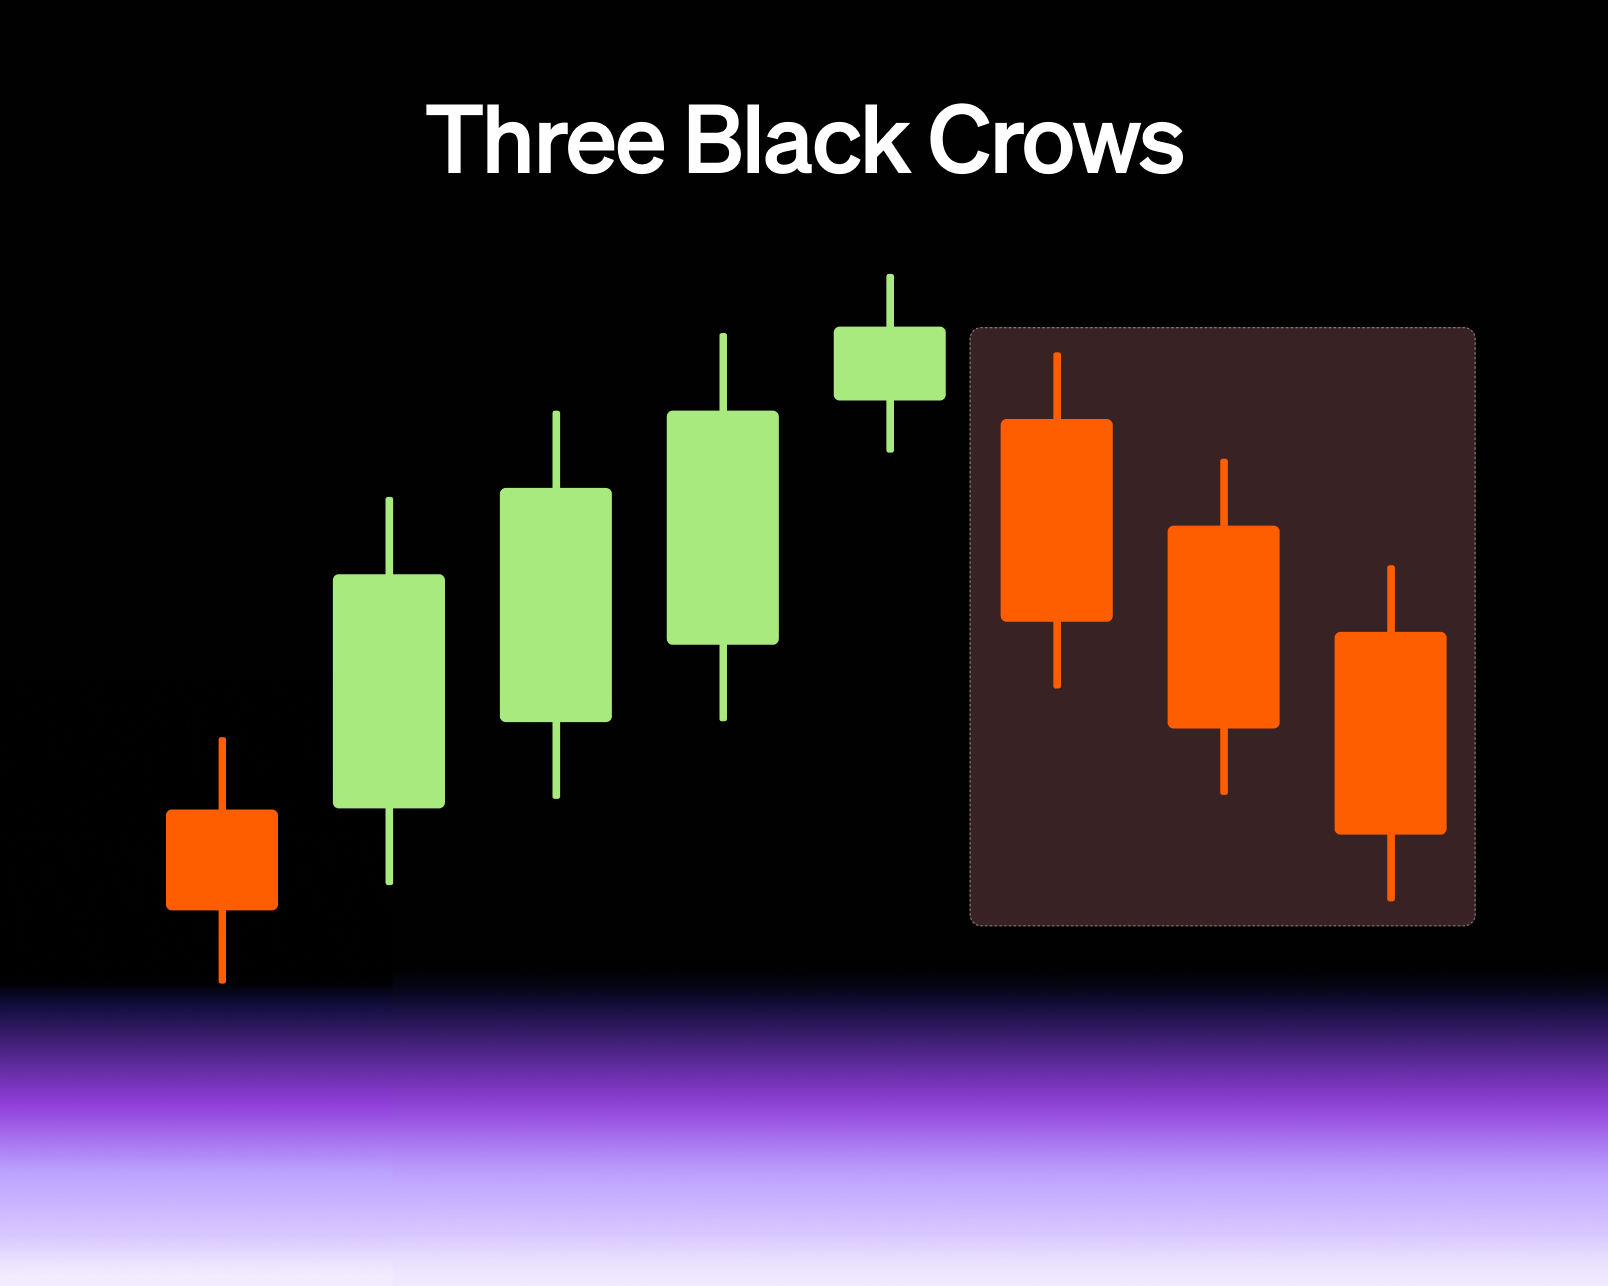
Three black crows
Typically three consecutive down candles, often interpreted as strong bearish pressure.
Best conditions:
- After a failed rally into resistance
- When downside candles close near their lows and wicks are modest
Failure mode:
- In crypto, sharp downside often triggers reflexive bounces. This pattern can mark the late stage of a drop, not the start, if you ignore context and volume.
The difference between smart pattern-reading and pattern-memorizing is simple: patterns matter most at important locations, and they matter more when the market follows through.
A simple 6-step process to read any crypto candlestick chart
If you want a repeatable way to read cryptocurrency candles without overthinking, use this process:
- Start on a higher timeframe (1D or 4H)
- Identify trend (higher highs and higher lows, or the opposite)
- Mark obvious levels (recent swing highs, swing lows, round numbers)
- Read the last 3 to 10 candles as a sequence, not a single signal
- Look for confirmation (follow-through candle, cleaner closes, reduced wick chaos)
- Define invalidation (what would prove your read wrong)
That last step is what separates analysis from guessing. Good chart-reading is not about being right. It is about being clear about what would make you wrong.
Worked example: reading a real chart (BTC)
Open a live chart and practice the process above. MoonPay’s Bitcoin price chart is a clean reference point because it shows price action on a widely traded asset.
Here is a simple scenario you will see often in crypto:
- On the daily timeframe, BTC is making higher highs and higher lows.
- Price pulls back toward a prior support zone.
- A candle prints with a long lower wick and a close back above the level.
- The next candle closes higher and has a healthier body (less wick noise).
What did the candles actually say? Not “guaranteed reversal.” They said sellers tried to push price down at that level and failed, and buyers were strong enough to close the interval back above the zone. The follow-through candle added confirmation that the rejection was not just a one-off wick.
This is also a good moment to remind yourself that “price up” does not always mean “risk down.” Understanding market capitalization in crypto helps keep perspective on what you are looking at when comparing BTC to smaller assets.
Mistakes beginners make when reading crypto candlesticks
Most early mistakes come from reading candles as if they were deterministic.
- Looking at one candle in isolation. Candles are part of a story, not standalone verdicts.
- Ignoring the higher timeframe. A “perfect pattern” on a 5-minute chart can be irrelevant against a daily trend.
- Treating long wicks as automatic reversals. Wicks are evidence of rejection, but rejection can fail.
- Overreacting to volatility spikes. Crypto is prone to sudden moves that distort candles.
- Using illiquid pairs as “signal.” Thin books create misleading candles.
- Assuming candlesticks predict fundamentals. Candles show behavior, not underlying value.
If you want the broader view of chart interpretation beyond candles, revisit how to read crypto price charts and treat candlesticks as one tool within that toolbox.
If you are not actively trading, candlesticks still help (but keep it simple)
You do not need to be a trader to benefit from candlesticks. They can help you understand volatility and avoid emotional decisions during sharp moves. But if your goal is long-term accumulation, you may not want a strategy that depends on reading every candle.
A common alternative is dollar-cost averaging (DCA), which focuses on consistency rather than timing. Candlesticks can still help you understand what kind of market regime you are in, but they do not need to drive every decision.
Quick FAQs
What do candle wicks mean in trading?
Wicks show the high and low reached during the timeframe and often represent rejection from those extremes. In crypto, long wicks can also reflect liquidity gaps and rapid volatility.
What timeframe is best for crypto candlesticks?
Beginners usually learn faster by starting on 1D or 4H because signals are less noisy. You can use lower timeframes later for detail, but build context first.
Do candlestick patterns work in crypto?
They can, but reliability depends heavily on context (trend, levels, liquidity). Patterns are not guarantees and fail frequently in choppy regimes or during sudden news events.
Why do crypto candles have huge wicks sometimes?
Crypto trades 24/7 and liquidity varies by asset and venue. Sudden market orders, liquidation cascades, or thin books can produce extreme highs and lows inside one candle.
What is the simplest candlestick pattern to learn first?
Start with candle anatomy (body and wicks), then learn doji and hammer concepts with a confirmation mindset. After that, bullish and bearish engulfing patterns are a practical next step.
Conclusion
Learning how to read candlestick charts is less about memorizing candlestick patterns and more about reading behavior with context. Focus on anatomy, timeframe, trend, and location. Then use a simple process so you are not reacting to every red or green candle crypto prints.
If you want more chart-reading fundamentals beyond candlesticks, MoonPay’s guide on how to read crypto price charts is the right next step.
Lightweight glossary of candlestick chart terms
Open (O)
The first traded price during the selected timeframe.
High (H)
The highest traded price during the selected timeframe.
Low (L)
The lowest traded price during the selected timeframe.
Close (C)
The last traded price during the selected timeframe.
Candle body
The range between open and close. A larger body often implies stronger directional push for that interval.
Wick (shadow)
The lines above and below the body showing the high and low reached. Wicks often indicate rejection or volatility within the interval.
Timeframe
The interval each candle represents, such as 1m, 1H, 4H, 1D. Changing the timeframe changes what “open” and “close” mean.
Trend
The directional structure of price over time, often described as higher highs and higher lows (uptrend) or lower highs and lower lows (downtrend). MoonPay’s guide to bull and bear markets is a helpful high-level reference.
Support and resistance
Areas where price has previously reacted. Candlesticks tend to matter more when they form near these zones.
Confirmation
Follow-through that supports a candlestick read, often the next candle closing in the anticipated direction or reducing wick noise.
Invalidation
A clear condition that would prove your interpretation wrong, such as price moving back through a key level.
Doji candlestick
A candle with a small body, where open and close are near each other. Often interpreted as indecision, especially near key levels.
Hammer candlestick
A candle with a long lower wick and a relatively small body, often read as selling rejection, especially when confirmed by the next candle.
Engulfing candle (bullish or bearish)
A two-candle pattern where the second candle’s body “engulfs” the prior candle’s body, sometimes suggesting momentum shift depending on context.
Liquidity
How easily an asset can be traded without moving price. Low liquidity often increases wick size and pattern failure rates.
Market capitalization (market cap)
Price times circulating supply, often used to contextualize the relative size of crypto assets. See MoonPay’s guide on market capitalization in crypto.

.png?w=3840&q=90)


.png?w=3840&q=90)